Difference between revisions of "Evaluation of diagnostic tests"
| (28 intermediate revisions by one other user not shown) | |||
| Line 1: | Line 1: | ||
| − | + | ==Introduction== | |
| + | <br /> | ||
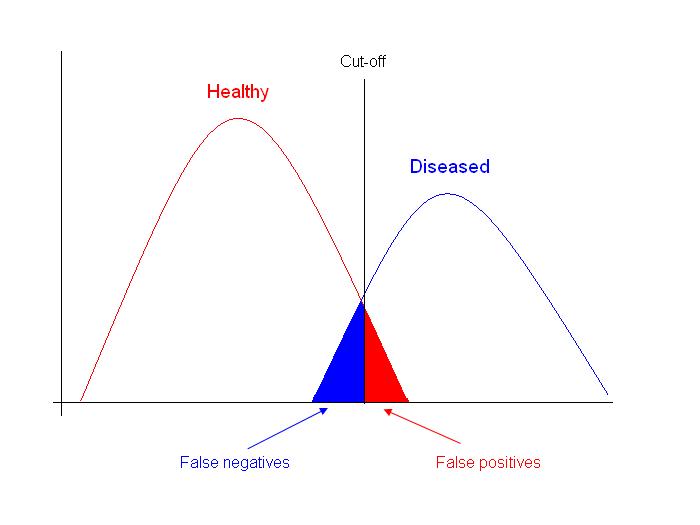
| − | + | A diagnostic test is an objective method of deciding whether an animal has a disease, or not. Decisions made following diagnostic testing are usually dichotomous e.g. treat or do not treat the animal, therefore diagnostic tests are usually interpreted as dichotomous outcomes (diseased or non-diseased). In this case, if a diagnostic test is measuring a continuous outcome e.g. antibody titre then a cut-off for classifying animal’s as positive or negative must be selected. The figure below shows that whereever the cut-off is selected there is usually some overlap between results i.e. some diseased animals will have the same value as non-diseased animals and resulting in some false-positive and false-negative results. | |
| − | + | [[File:Diagnostic test results.jpg]] | |
| − | |||
| − | |||
| − | |||
| − | |||
| − | |||
| − | + | ==Interpretation of diagnostic tests== | |
| − | + | Several statistics can aid clinicians in the interpretation of diagnostic tests these include '''sensitivity''' and '''specificity''', '''predictive values''', '''likelihood ratios''' and '''pre-''' and '''post-test probabilities'''. The following 2 x 2 table is often used by epidemiologists to calculate these statistics: | |
| − | |||
| − | |||
| − | |||
| − | |||
| − | |||
| − | |||
| − | |||
| − | |||
| − | + | [[File:table.jpg]] | |
| − | |||
| − | |||
| − | |||
| − | |||
| − | |||
| − | |||
| − | |||
| − | |||
| − | |||
| − | |||
| − | |||
| − | |||
| − | |||
| − | |||
| − | |||
| − | |||
| − | |||
| − | |||
| − | |||
| − | |||
| − | |||
| − | |||
| − | + | ===Sensitivity and specificity=== | |
| − | Sensitivity | + | '''Sensitivity (''Se'')''' is the probability that a positive animal is correctly identified as positive and '''specificity (''Sp'')''' is the probability a negative animal is correctly identified as negative. |
| − | : | + | [[File:specificity.jpg]] |
| − | + | ===Predictive values=== | |
| − | + | There are two types of predictive value; '''positive predictive value (PV+)''' is defined as the probability that an animal which tests positive actually has the disease and '''negative predictive value (PV-)''' is the probability and animal that tests negative does not have the disease. PV+ and PV- are calculated as follows: | |
| − | + | [[File:predictive value.jpg]] | |
| − | + | ===Likelihood ratio=== | |
| − | + | Likelihood ratios (LR) give clinicians an idea of how likely a test result could have been produced by a diseased compared with a non-diseased animals and can be calculated for both positive and negative test results. The LR for a positive test result (LR+) is interpreted as how likely it is to find a positive test result in diseased compared with non-diseased individuals and LR- is interpreted as how likely it is to find a negative test result in diseased compared with non-diseased animals. Likelihood ratios are a characteristic of the test and do not depend on prevalence, they are calculated as follows: | |
| − | |||
| − | + | [[File:likelihood ratio.jpg]] | |
| − | Before performing a diagnostic test a veterinarian usually has an idea of the likelihood that an animal has a disease, usually based on the levels of the disease in the population. The probability that an animal has a disease before a diagnostic test is performed is termed the | + | ===Post-test probability=== |
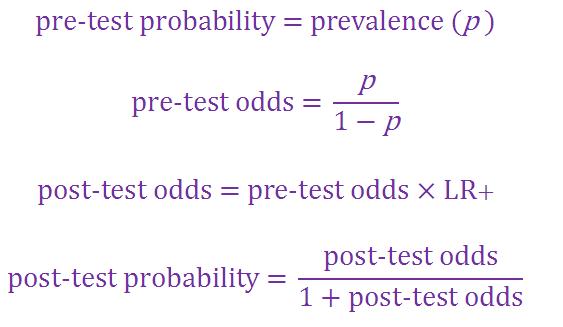
| + | Before performing a diagnostic test a veterinarian usually has an idea of the likelihood that an animal has a disease, usually based on the levels of the disease in the population. The probability that an animal has a disease before a diagnostic test is performed is termed the '''pre-test probability''' and is usually the prevalence of the disease in the population, but can be modified depending on other factors e.g. whether the animal is showing symptoms of disease, whether certain risk factors for disease are present. Once a diagnostic test has been performed this probability can be modified to incorporate the results of the diagnostic tests to give an overall probability that an animal has the disease i.e. '''post-test probability.''' This is carried out as follows: | ||
| − | + | [[File:post-test probability.jpg]] | |
| − | |||
| − | |||
| − | |||
| − | |||
| − | + | [[Category:Veterinary Epidemiology - General Concepts|K]] | |
| − | |||
| − | |||
| − | |||
| − | |||
| − | |||
| − | |||
| − | |||
| − | |||
| − | |||
| − | |||
| − | |||
| − | |||
| − | |||
| − | |||
| − | |||
| − | |||
| − | |||
| − | |||
| − | |||
| − | | | ||
| − | |||
| − | |||
| − | |||
| − | |||
| − | |||
| − | |||
| − | |||
| − | |||
| − | |||
| − | |||
| − | |||
| − | |||
| − | |||
| − | |||
| − | |||
| − | |||
| − | |||
| − | |||
| − | |||
| − | |||
| − | |||
| − | |||
| − | |||
| − | |||
| − | |||
| − | |||
| − | |||
| − | |||
| − | |||
Latest revision as of 15:28, 3 May 2011
Introduction
A diagnostic test is an objective method of deciding whether an animal has a disease, or not. Decisions made following diagnostic testing are usually dichotomous e.g. treat or do not treat the animal, therefore diagnostic tests are usually interpreted as dichotomous outcomes (diseased or non-diseased). In this case, if a diagnostic test is measuring a continuous outcome e.g. antibody titre then a cut-off for classifying animal’s as positive or negative must be selected. The figure below shows that whereever the cut-off is selected there is usually some overlap between results i.e. some diseased animals will have the same value as non-diseased animals and resulting in some false-positive and false-negative results.
Interpretation of diagnostic tests
Several statistics can aid clinicians in the interpretation of diagnostic tests these include sensitivity and specificity, predictive values, likelihood ratios and pre- and post-test probabilities. The following 2 x 2 table is often used by epidemiologists to calculate these statistics:
Sensitivity and specificity
Sensitivity (Se) is the probability that a positive animal is correctly identified as positive and specificity (Sp) is the probability a negative animal is correctly identified as negative.
Predictive values
There are two types of predictive value; positive predictive value (PV+) is defined as the probability that an animal which tests positive actually has the disease and negative predictive value (PV-) is the probability and animal that tests negative does not have the disease. PV+ and PV- are calculated as follows:
Likelihood ratio
Likelihood ratios (LR) give clinicians an idea of how likely a test result could have been produced by a diseased compared with a non-diseased animals and can be calculated for both positive and negative test results. The LR for a positive test result (LR+) is interpreted as how likely it is to find a positive test result in diseased compared with non-diseased individuals and LR- is interpreted as how likely it is to find a negative test result in diseased compared with non-diseased animals. Likelihood ratios are a characteristic of the test and do not depend on prevalence, they are calculated as follows:
Post-test probability
Before performing a diagnostic test a veterinarian usually has an idea of the likelihood that an animal has a disease, usually based on the levels of the disease in the population. The probability that an animal has a disease before a diagnostic test is performed is termed the pre-test probability and is usually the prevalence of the disease in the population, but can be modified depending on other factors e.g. whether the animal is showing symptoms of disease, whether certain risk factors for disease are present. Once a diagnostic test has been performed this probability can be modified to incorporate the results of the diagnostic tests to give an overall probability that an animal has the disease i.e. post-test probability. This is carried out as follows:


